What makes this project unique is the interactivity and control the user has. The users control extends past the general off and on commands and reaches a true user defined infographic. By supplying over 40 buttons on the application you can focus in your interests and create a categories relevant to you.
This 10-week course aims to explore contemporary information graphics as a design practice as well as an art practice. We will take an in depth look at varies ways designers and artists worldwide working with information to create works that has great impact on our understanding of our lives, past, present, and future. Following the examination of leading practitioners’ work, each student will create two information graphic projects to tell stories of Portland Oregon.
Thursday, March 24, 2011
Portland Camera Locations
Friday, March 18, 2011
Thursday, March 17, 2011
Finally. brians Congestion infographic
Congestion Tax Infograph
after seeing many sunrises it finally works. its a bit pixelated as i have not mastered the compression factors between programs. so the cloud represents clean nice air, where when you click on a city, the cloud mutilates into an oily toxic stained jagged structure. and then data animates out. thats pretty much it. the bar graph next to the cities was an attempt at trying to give the viewer a total representation of the data. to get a better visual picture of how they all compare to eachother. i think next time ill foucus more on the visual representation of the data, rather than an "artsy" approach. i think just more of a straight forward look with all the data showing at the same time would be nice. but im glad i suffered through this to figure out how to get it to work.
Wednesday, March 16, 2011
Pill-Box Infographic Sculpture
White Stag "Side Effects"
This project was inspired by my experiences thus far in school at the White Stag building. Since it as a separate program carries a considerable amount of mythology about it, I thought it would be fitting to produce a piece based on the White Stag facade, that cast a spotlight on the unexpected realities of the program in spite of the expectations often associated with it. Along with the prescribed purpose of a particular method, remedy, institution, et al, there are often unintended side effects. This thought informed my use of the construction reminiscent of a pill box, with laser-cut acrylic icons take the place of different types of medication. These icons are supplements to the descriptions engraved on the front of each of the cells, all of which are designed to further emphasize their quantitative elements. Along with the prescribed purpose of
Updated Infographic
Here is an updated version of my original infographic showcasing details of Portland's markets for both veganism and carnivorial gastronomy. The Portland food scene is considered to be at the forefront of both the vegan and the meat-centric culinary movements. I found the coexistence of these two powerful presences to be worth investigating.
Tuesday, March 15, 2011
Portland Food Cart Table
The food cart table was built off of my first infographic. The idea of the coffee table came from were one would typicaly eat take out food at home, and as a nice answer to "hummm where should I/we eat lunch today?" That and I thought it would look really cool as a coffee table.
here are some pics I took along the way:
ply wood with the corners cut for the legs and the holes for the dowels CNC-ed
the dowels put in to the plywood
with the glass on top
In full Table-y glory
and a side view
....... ok ok so it is not completely finished... but you thought it was!!!! still have structural issues with the legs and I have to paint the ends of the dowels and stain the wood.... but not a bad go for only my second attempt at a piece of furniture in my whole life.....
Infographics Final Map
![](https://blogger.googleusercontent.com/img/b/R29vZ2xl/AVvXsEhOymzcRgqfwxugel-VIKLNQO6oDSXrcjCyCNtY1QOvonunIBQf2YPEz7o_eA0AzSJzwf0eCs5B1myEj3P_6NnYX67fdPQKENTPYYMAlhU7ouEWkpRMhFDJt0O7XeY5BdsnkbSGBOKrwtz8/s320/90dpiji.jpg)
This infographic map is based on my experience living in Portland for the past 6 months. I've highlighted routes and places that I've frequented, as well as a few memorable experiences. The images were painted to give it a more hand-done/first-hand experience feel, although I actually used Google Street View to reference a number of locations. This also cites back to my use of Google Maps whenever I need directions to get from one place to another. It would be interesting to keep adding more places as time goes on and my experience in Portland expands.
MAX
![](http://3.bp.blogspot.com/-CTZMs6stLnk/TX-4L82W8HI/AAAAAAAAABE/dqfz7s0TmK0/s400/MAXinfo1.jpg)
SkyLine
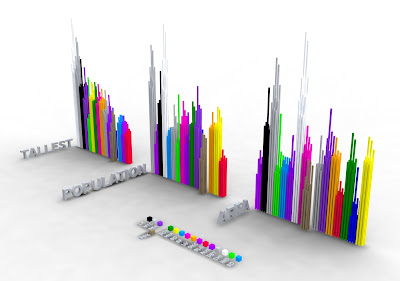
SkyLine is a visualization of what it means to be a "big" city. Portland is known as a little big city and i was curious as to what that meant. I researched 16 cities and collected data on their tallest buildings, population, and area.
Through my data collection I created a skyline of America. The cities i chose all came to mind when i thought about big cities in America.
Seattle, Portland, San Francisco, San Diego, Los Angeles, Las Vegas, Salt Lake City Austin, Houston, Oklahoma City, Chicago, Detroit, Boston, New York City, Wshington DC and Miami.
To start I collected the top 9 tallest buildings from each city and phyisically combined them to create a SkyScraper for each city.
This is a digital model showing these SkyScrapers arranged by city area, population and Building height.
![](https://blogger.googleusercontent.com/img/b/R29vZ2xl/AVvXsEjVDO8_dx9oa-U2lBs5jT4hxbuxctHX93x_wCn3Hm4Tp_RCvmUs2lN6DJKjOEcq6TxUspGlir4frzibHhQGx7xmsU4QiuhnMH5cYtrYgr6Oa4QW85i1ttes7DBFz7FTlAGWeb6WZ_bylKw/s400/untitled.578.jpg)
Interactive Portland Neighborhood Map
![](https://blogger.googleusercontent.com/img/b/R29vZ2xl/AVvXsEgG2_BWgOqfEnLMVoNh_E2ByU42iNF1BSQgggeNV7Ew12fQXX-_vJ-4aM9Oyz5NXny6Dr1J84BnWlKtqo0-0O4Ouyy6nqnuJdWawCaEe04W2JDVfNNgmEibOh91xtUKhoYzAkLV8RAl-jE/s400/Screen+shot+2011-03-15+at+1.16.44+AM+%25282%2529.png)
![](https://blogger.googleusercontent.com/img/b/R29vZ2xl/AVvXsEg-4rWetCnjUNkKcFRAIJzUYoGpZu4qqYlv4epJ7b7GzWV8GyVQGhuXhK0-ZwgUwwi_ulueaTIoGqoPJh5elpONQxX6iOI1biwqkQgGc_xc38QCEFQI9tEHGid7ZQZGcWwWAi0z_ssCLu4/s400/Screen+shot+2011-03-15+at+2.07.58+AM+%25282%2529.png)
![](https://blogger.googleusercontent.com/img/b/R29vZ2xl/AVvXsEg8kT8WZzf9t8CkQrj3l2gs7r6yiaONeS4jEHuj5Ab5N7zHsDgzUb24Cj9WnY_O66tlmHTdjcinyzScOWAj9JZ4HQYJ9TPIVPRM5LIH_22qePavoyGDjTm_de1NPW8OAOkC_yLlMX4Yjtk/s400/Screen+shot+2011-03-15+at+1.17.59+AM+%25282%2529.png)
![](https://blogger.googleusercontent.com/img/b/R29vZ2xl/AVvXsEj6fITM76qzKwCJlIeIT-XLzEiSfoDB_WbK4Z2YAcpV3PqwWo5a9A8Z2HC-nhpThl2PKpZbvY5FnJ4sFvbr7i2UfjJDc6-pqAqIIEmtjl2yD8suIJA8Jx6rKSbpnQ2FkAXDcalQNN9RfNQ/s400/Screen+shot+2011-03-15+at+1.19.32+AM+%25282%2529.png)
![](https://blogger.googleusercontent.com/img/b/R29vZ2xl/AVvXsEiWNom7TzqWQeBvdwnuft8jiuWPfwpCz3CeGNvmDUAZQRCmiXvtXQKkkOF350ku4DOQPMNzBpDlBFsxLDfha1fi7i1DUFClz0wwWP5cOZJYmrCrEOcx0CKLfU8ie_cqMiOtBYG4THid5kY/s400/Screen+shot+2011-03-15+at+1.47.40+AM+%25282%2529.png)
![](https://blogger.googleusercontent.com/img/b/R29vZ2xl/AVvXsEhRyUN0lS3Vu8pxtg6Cd9LNHGN2zbjYncvsnUKcxswXGdfrOF9b1vWqiOrh6AKQ3JYH7pAr9CZGIbCRfrdwnq2oSPCkMknAcxqCZ5VOShudz2E3Geoz9d3q2vkgKo4_i8P8Yd0Fxy5S8T0/s400/Screen+shot+2011-03-15+at+1.20.37+AM+%25282%2529.png)
![](https://blogger.googleusercontent.com/img/b/R29vZ2xl/AVvXsEiTZcCsTLfyxy_yLYKPCre9kttcXRkfKS9hbmQ2WUTrShAeMgn9OxPnaso7Cnd5tYx05ekI-IDfviyzdXPshXw8aXxksJQBfnUo02k2Qjg4932Tl2a9fr3FD5qBD6zXYJ9OpkXLzrEWGBQ/s400/Screen+shot+2011-03-15+at+1.18.54+AM+%25282%2529.png)
![](https://blogger.googleusercontent.com/img/b/R29vZ2xl/AVvXsEiNetG6cHeGE2V8_BYTkFkTVADV8NPR_KNNddTLGcWijCDSQQbWYQ_QC-Ynh0SOX529ejFeXJtSwN1iTMJKjkS3iWzx5j6IrnlaGib-00T6qP84_cQ-Dy5Is67oEKpZdSyLImHNAKFevvc/s400/Screen+shot+2011-03-15+at+1.45.53+AM+%25282%2529.png)
Basically, for my final infographic I wanted to use interactivity to convey more information about the neighborhoods in Portland. The print version color coded and rated Portland's neighborhoods in order of house value and cost of living, but I also wanted to reveal who lives in each of the neighborhoods to see if it there was any correlations. The new information gives total population, percentage of college grads and their median income. I couldn't figure out how I could upload the swf to the blog so here are a few screen shots of some of the features.
Monday, March 14, 2011
Dean's Final Project
This project was a visualization of the difference between a West Coast and an East Coast NBA team. The red lines represent distance traveled by the Portland Trailblazers and the Green lines represent the distance traveled by the Boston Celtics. Both teams are located in the Northern hemisphere of the United States, however, because teams are packed in closer on the Eastern conference, Eastern teams have much less distance to travel. This is one of the reasons why players prefer playing on the East Coast.
![](http://1.bp.blogspot.com/-d3g3-yD4vmk/TX8JzDwD_gI/AAAAAAAAAsk/u3k4oc-sW8w/s200/acrylic%2Binfographic.jpg)
![](http://4.bp.blogspot.com/-1XVuCYhcMIQ/TX8H8SyFejI/AAAAAAAAAsc/lcB4GZ4mFJs/s200/acrylic%2Binfographic3.jpg)
Final Project
![](https://blogger.googleusercontent.com/img/b/R29vZ2xl/AVvXsEiVz7xeWk6WxmRopAoKLyytde96Tt4ZNRaDKiU4vmLo5h43tk0h56_BiZh74VM6pmLWvEBEkOajgjw5p8M4jxtHz4IwdVGLVQHqqIaubjLuy-aOdki5bAW52F4U4kus9uU4tNjQU1UjCYs/s320/map.jpg)
This project was all about documenting my trips around Portland as I took photographs. The dates span from November of 2010 to March of 2011. I drew the map by hand and only marked streets relevant to where I went and what I took photos of so it acts as more of a "treasure map" for me and less of a google map. The corresponding contact sheet of photos is chronologically ordered so you can somewhat trace photographs to location on the map.
Saturday, March 12, 2011
Information Graphics Final
I cut an old door into 486 pieces then glued the pieces back together to represent historical buildings located in Portland's alphabet district. The amount of buildings on the streets are represented by the z axis the larger blocks representing two buildings and the smaller block representing one. On the top of each is stamped with a date that shows the year the buildings were built. The link listed below a stop motion animation of the entire process.
http://threet.tumblr.com/
Thursday, February 24, 2011
YouTube "Map My Summer" Project
![](https://blogger.googleusercontent.com/img/b/R29vZ2xl/AVvXsEha22VqMIlDdiCkCIZJ4lDgwcvKtpnHPwZAXpukx5y0m_KXmrWils9RQextOui_oBQoFkP0Hy__00XEgkwD_sTnW95o_KLQ6jkPWdoCMcxQVsvaURicaaoKVWPHD7kgo8YQK8BFonPlXedJ/s320/youtube_my_summer.jpg)
Tuesday, February 22, 2011
Week 8 Note
Monday Individual meetings: the 12 meetings I had with you were very productive and many of you are developing truly promising and exciting projects.
Wednesday class session: Present your project for class progress review and critique. You may also continue to share your inspirations.
Here is one from me that I want to share, mostly the idea of "Life is Art" where we take real life measurement as the element of artwork, like many of you are doing in this class:
Roman Ondák discusses Performance 4, Measuring the Universe, at MoMA
Sunday, February 20, 2011
Friday, February 18, 2011
Subscribe to:
Posts (Atom)